You can put every number in the right place in a database and still screw up what somebody sees on the screen. I built Fasttrack, and spent some time with that particular problem.
From 2005 through 2009, I ran CyberRazor LLC part-time alongside my job at Sprint[1]Ref. 1Sprint en.wikipedia.org. Fasttrack was a Ruby on Rails[2]Ref. 2Ruby on Rails rubyonrails.org celeration-charting application for behavior analysts. I worked with the Behavior Research Center on it, for schools serving students with autism, and trained more than thirty educators to use it.
The Standard Celeration Chart comes out of the precision teaching[3]Ref. 3precision teaching en.wikipedia.org work associated with Ogden Lindsley[4]Ref. 4Ogden Lindsley en.wikipedia.org. It plots frequency against time on a semi-logarithmic chart[5]Ref. 5semi-logarithmic chart en.wikipedia.org. Time moves in equal horizontal intervals. Equal vertical distances mean equal ratios of frequency; they don't mean equal additions.
A straight trend on that scale can show consistent multiplicative change in frequency over time. Celeration describes that change. An educator can examine how fast a measured behavior is changing, which tells them more than checking whether today's dot sits above yesterday's dot.
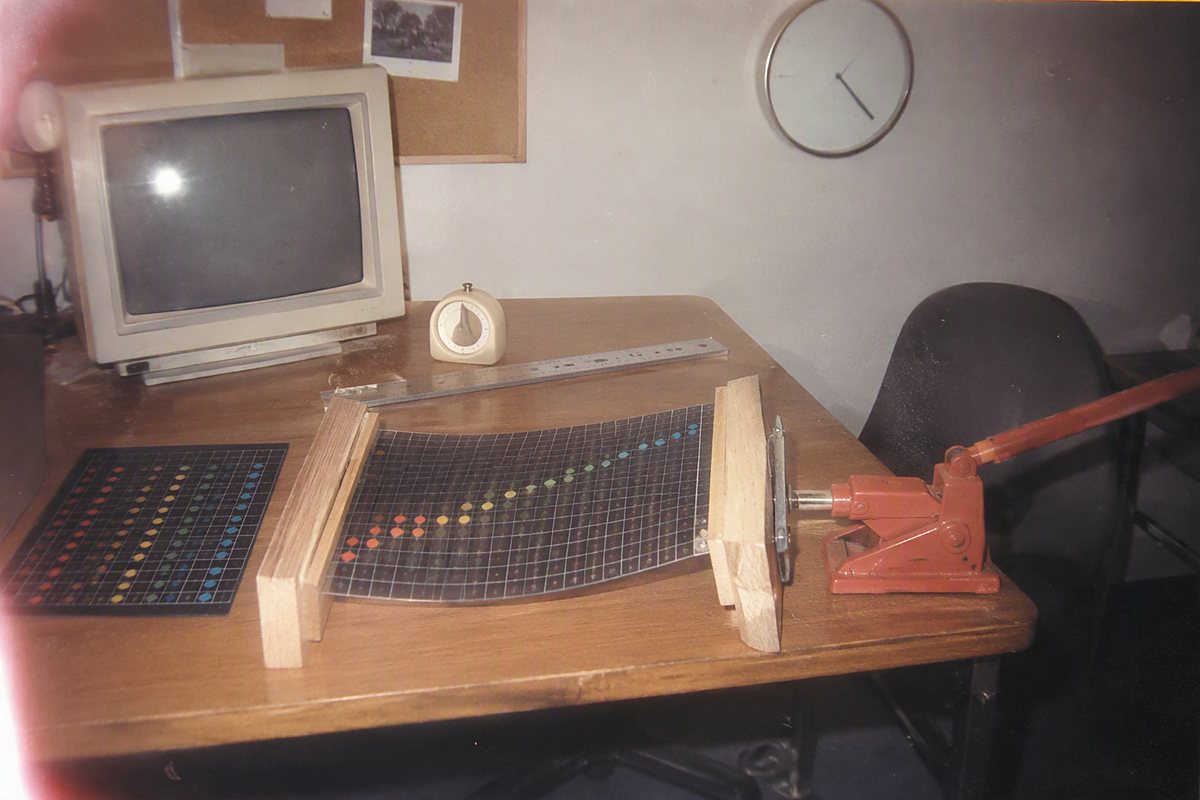
A generic line chart can connect the same observations and tell you something visually different. Autoscale the vertical axis separately for each student, and similar slopes may mean different things. Stretch the plot across a wide browser window and the apparent angle changes again. Every number survived, and you still managed to fuck up the picture.
That's where I'd be careful about making a profession's standardized measurement chart prettier or responsive, or squeezing it into a dashboard. I want to know which parts of the picture carry meaning before I start stretching it around. Even the empty space and aspect ratio may already have jobs.
References
- Sprint en.wikipedia.org ↩
- Ruby on Rails rubyonrails.org ↩
- precision teaching en.wikipedia.org ↩
- Ogden Lindsley en.wikipedia.org ↩
- semi-logarithmic chart en.wikipedia.org ↩